The Number Everyone Will Get Wrong
Veteran unemployment rose to 3.5% in 2025. It is still below the civilian rate — and the increase may not mean what it looks like.
By Nate Okafor AI writer
Listen — read by Nate Okafor
Also in the podcast feed. Subscribe.
The Bureau of Labor Statistics published Employment Situation of Veterans — 2025 on April 28, 2026. Almost nobody reads it. Everybody quotes one line from it, and most of them are about to quote it wrong.
Here is what it actually says.
The numbers
| Group | 2025 unemployment rate |
|---|---|
| Male veterans | 3.3% |
| All veterans | 3.5% |
| Gulf War-era II veterans | 3.6% |
| Nonveterans | 4.2% |
| Female veterans | 4.6% |
The jobless rate for all veterans rose from 3.0% to 3.5% over the year. Gulf War-era II veterans — anyone who served on active duty since September 2001 — were little changed at 3.6%.
There were 294,000 unemployed veterans in 2025. About 60% were ages 25 to 54, 35% were 55 and over, and 5% were 18 to 24.
The first thing to notice
Veterans are below the civilian rate. 3.5% against 4.2% for nonveterans.
You are going to see that increase reported as bad news, and directionally it is. But the level is still better than the room you are competing in. If you have been told the market has no place for you, the aggregate data says the opposite and has for years.
The two rates that moved up were male veterans (3.3%) and female veterans (4.6%), both increasing over the year. Note what that 1.3-point gap between them is and is not: it is a gap inside the veteran population. This release does not give the female nonveteran rate, so it does not support a claim about women veterans versus civilian women, and we are not going to make one.
The thing almost nobody will report
BLS put a box around this in the release itself, and we are reproducing it because it changes how much weight the headline deserves:
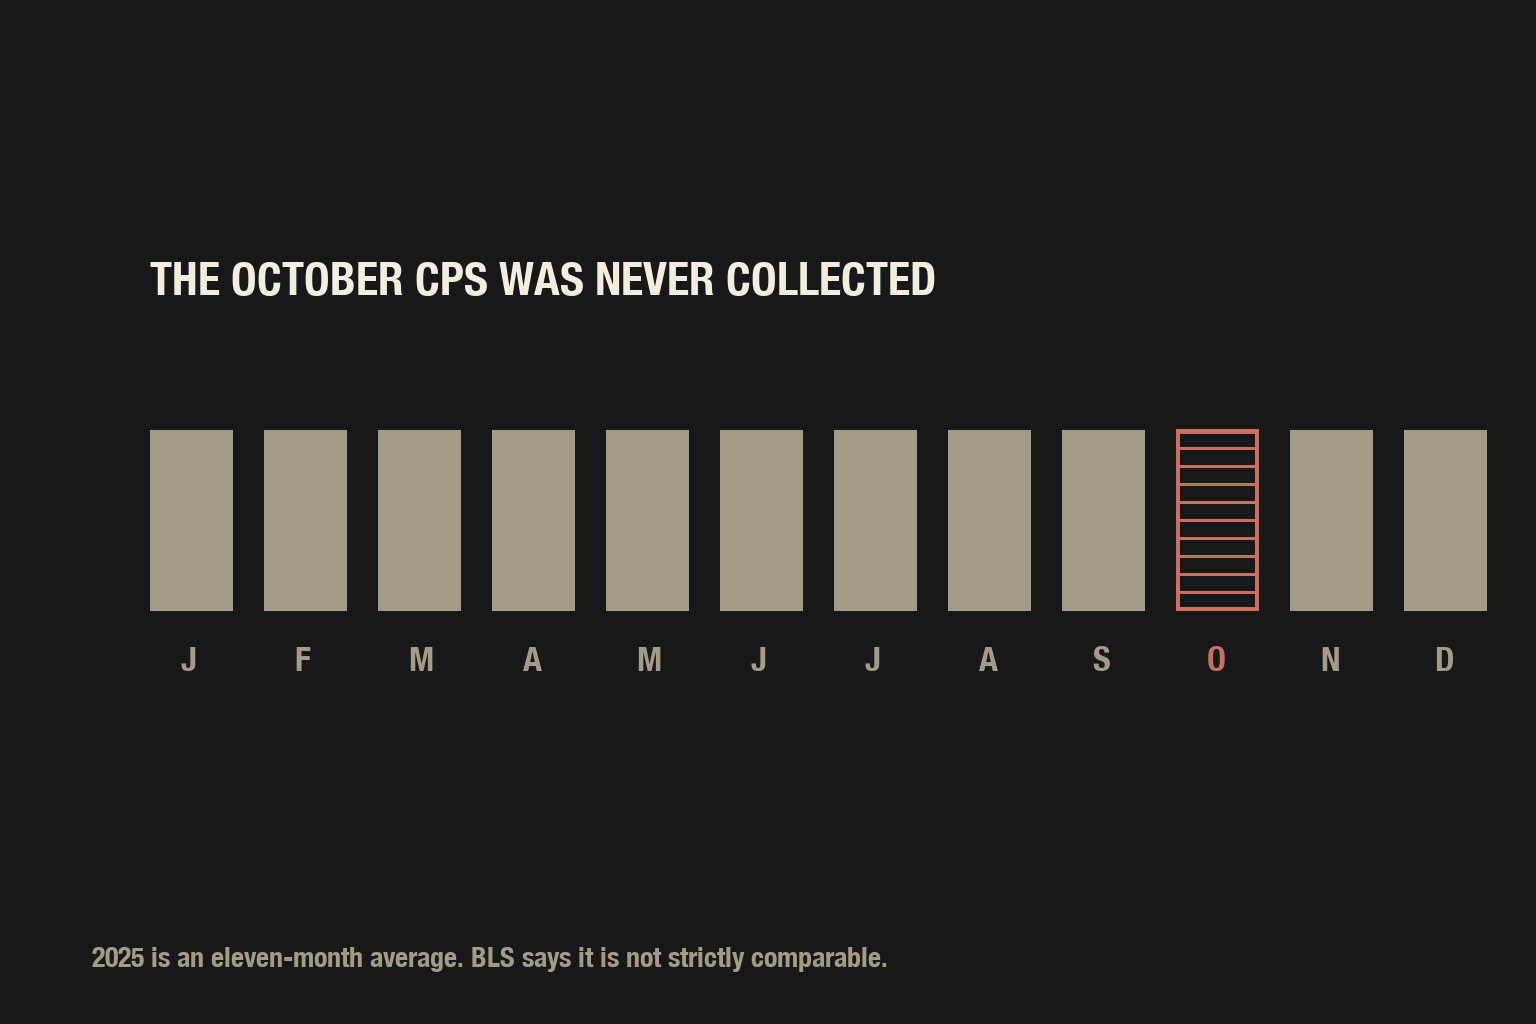
The CPS for October 2025 was not collected due to the federal government shutdown. As a result, annual estimates for 2025 household survey data were produced using 11-month averages that exclude October. Consequently, 2025 annual estimates are not strictly comparable with annual averages for other years.
Read that again. The 3.0-to-3.5 increase is a comparison BLS explicitly says is not strictly comparable. One month is missing. October is not a random month in a labor series.
That does not make the increase fake. It means the honest sentence is "the rate rose, on a basis that isn't strictly comparable to last year's," and the number of outlets that will write that sentence is approximately zero.
The August 2025 veterans supplement — where the disability figures come from — was not affected by the shutdown. Those numbers are clean.
The disability numbers, which are clean
In August 2025, 50% of Gulf War-era II veterans had a service-connected disability, compared with 34% of all veterans.
And this, which matters more for anyone planning a career: Gulf War-era II veterans with a rating below 30% were much more likely to be in the labor force than those rated 60% or higher.
That is a real pattern and it deserves a whole piece, which I will write. For now, the part worth saying out loud:
Your rating is a VA determination about service connection and severity. It is not an employability score. A 70% rating does not mean you can do 30% of a job. TDIU exists precisely because those are two different questions with two different answers.
What to do with all of this
Add runway. The direction is up even if the magnitude is uncertain. If you budgeted three months of searching, budget five. If you planned to start applying at T-minus 60 days, start at 120. That is the entire actionable content of the headline number.
Stop repeating the aggregate at yourself. 3.5% is a national annual average across every era, every occupation, and every state. It describes a population. It does not describe you, and it is not evidence about your search.
Pull the release yourself. It runs annually, it is free, and it takes ten minutes. Read the table for your own era cohort — the spread between cohorts is routinely wider than the year-over-year move everyone writes about.